

CME INDIA Presentation by Dr. D.P. Khaitan, MD (Medicine) FCGP(IND) FIAMS(Medicine) FICP FICCMD, FIACM, Consultant Physician, Gaya.
Triaxial Bipolar System
The credit goes to Dr. William Einthoven who had inscribed a ‘Triaxial Bipolar System’ with three leads as standard leads I , II and III and accordingly the concept of manifest potential difference in the heart came first to his mind.
Every dynamic system is having its own axis – the reference point around which it takes its motion . Deviation in its expected axis is often the first pointer to the nature of its underlying forces at play. This quantitative shift tells the story of homeostatic disturbances in its territory.
The heart being the biological dynamic system behaves in the same way , it sends its message through the electrical waves in its territory , the interpretation of which paves the way of its axis determination.
- The cardiac axis reflects the net direction of the heart’s electrical depolarization, summing all individual vectors into a single dominant flow.
- ECG axis determination is about translating electrical impulses into meaningful clinical insight through a mathematical number.
Clinicians determine the cardiac electrical axis to have the concept – whether the heart is sending its message of electrical spread through its normal axis or it is spreading the waveforms of pathophysiological changes by shifting its axis.
1. Introduction (Keypoints)
The heart is the supremo source of electromagnetic flow over the human body , the concept of which possibly compelled the mind of Einthoven to think in term of a hypothetical electrical equilateral triangle , which is surrounded by the right arm and left arm from above and left leg from below as an extension of its electromagnetic field. The heart with zero potential is considered to lying at the centre of this triangle.
Before understanding the rule of 90 degree in context with ECG axis determination, it would be worthwhile to discuss how the cardiac electrical axis came into existence – The credit goes to Dr. William Einthoven who had inscribed a ‘Triaxial Bipolar System’ with three leads as standard leads I, II and III and accordingly the concept of manifest potential difference in the heart came first to his mind.

The manifest potential difference in the heart – His remarkable concept of biophysics set forth a new concept first time in the history of ECG. Einthoven inscribed the famous equilateral triangle formed by leads I, II and III at its side and derived a very important calculation what he called ‘ the manifest potential difference in the heart,’ it can be equated to the Electrical axis.
A new concept of electrical vector came into existence:
To his statement “The curve must represent under all circumstances and in every moment, the algebraic sum of all the potential differences which at that moment are developed in the heart.” His this concept might have hinted and compelled the minds of future researchers to frame the concept of electrical axis having a definite magnitude and direction.
NB:
If the exploring electrode is placed at any point on the body surface beyond 15 cm from the central position of the heart , there is hardly any noticeable effect on the intensity of the
current*. The points of electrodes placement on the three limbs used by Einthoven were having somewhat longer distance , each more than 15 cm away from the centre of the heart. By considering this fact the triangle is assumed to be equilateral in nature.
Ref:
* LeoSchamroth – An Introduction to ELECTROCARDIOGRAPHY – EIGHTH ADAPTED EDITION – Basic Principles – Page 6 (‘ With distances greater than 15 cm from the heart, the decrement in the intensity of the electrical field is hardly noticeable. Consequently, all electrodes placed at a distance greater than 15 cm from the heart may, in an electrical sense, be considered to be equidistant from the heart ’).
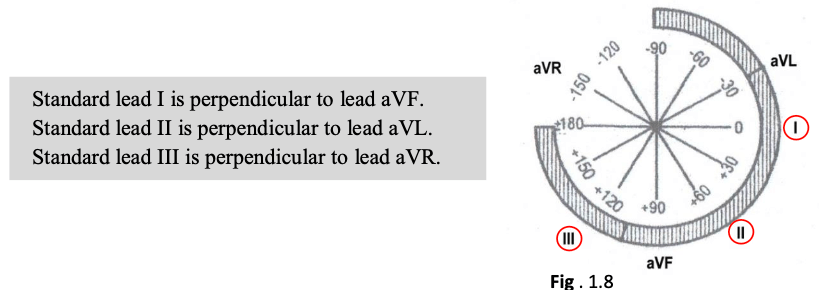
The concept of hexaxial lead system
By combining together Einthoven triaxial lead system (I, II & III) with that of Goldberger’s lead system (aVR , aVL & aVF) gives birth to the hexaxial lead system – the intersection of leads I , II & III is allowed to pass through the centre of so framed hexaxial lead system and leads aVR , aVL & aVF are considered to be projected from the centre to the corresponding angles. This hexaxial lead system is thus the display of the six limb leads over the vertical plane, as illustrated below:

2. Electrical axis hypothesis and the rule of 90-degree
The endless labour of EINTHOVEN opened the beginning of a new chapter in the history of electrocardiogram – the delivery of his lecture in 1912 addressing at the Chelsa Clinical Society in London describing the important principle – ‘The manifest potential difference in the heart’ in relation with his equilateral electrical triangle (Later on it was known as Einthoven’s triangle). Unfortunately he died in the year 1927 , soon after being awarded with Nobel Prize in 1924 for his discovery of the Mechanism of Electrocardiogram. In 1942 EMANUEL GOLDBERGER, cardiologist of Lincoln Hospital, New York invented unipolar limbs system (aVR aVL and aVF) , which facilitated the formation of hexaxial lead system. The author of this article feels a dire necessity of explaining the rule which can easily help in the determination of ECG axis in the light of hexaxial lead system – this can be addressed as the rule of 90-degree. This also helps in understanding how the shape of a wave is assumed as per the rule of 90-degree.
Basic principle: Electrical axis hypothesis and the rule of 90-degree (also see the next page)
- The cardiac axis is the sum of all depolarization units of the heart and it is having the maximum flow of current along its axis, having a definite magnitude and direction .
- In any given electromagnetic field the voltage of any waveform depends upon its relative proximity to the electrical axis – the more nearer is the wave to the electrical axis, the more will be its voltage intensity being reflected by its amplitude.
By considering the above facts the concept of electrical axis hypothesis which states that electrical axis is an electrical field vector and the voltage recorded in a particular lead is the result of angulation in between cardiac electrical axis and the lead vector itself. The amount of flow of the current through a particular lead is inversely proportional to the angulation in between cardiac vector and lead vector. The whole concept has been illustrated as below:

- If the exploring electrode is within 90-degree of cardiac electrical axis , it would produce positive wave with R-wave dominance and vice-versa is also true if the electrode is beyond 90-degree. If the electrode is exactly at 90-degree to the cardiac electrical axis , it would produce the equiphasic wave or no deflection.
As per rule of 90 degree :
If an exploring electrode is within 90° of the CEA → Positive wave (R wave dominance)
If an electrode is exactly at 90° to the CEA → Equiphasic (R = S) or no deflection
If an electrode is beyond 90° from the CEA → Negative wave (S wave dominance)
CEA = Cardiac Electrical Axis

3. Determination of electrical axis as per rule of 90-degree
All the steps described below are based on the rule of 900
STEP 1: QUADRANT DETERMINATION
Leads I and II are chosen for the purpose since they cover the normal range of QRS axis (-300 to +900) – QRS positivity in between these two leads indicates normal axis and deviation on either side indicates left axis and right axis deviation respectively.


STEP 2: APPROXIMATION METHOD
Once the quadrant identification is completed , the next step would be adopted to arrive to the nearest multiple of 30 degree – the smallest range of angulation in between two leads of hexaxial lead system).
- Find the lead with the most positive QRS → CEA is closest to this lead axis.
- Find the equiphasic lead → The CEA is perpendicular (90°) to this lead.
- The miscellaneous way of calculation QRS axis.
- Find the lead with the most positive QRS → CEA is closest to this lead axis.
- It may be found within the nearest range of 300 on the side , closest to the lead having the most positive QRS. Cardiac electrical axis is found to be tilted towards the lead having R-wave with more amplitude.
- The net positivity in any lead is obtained by subtracting the smaller deflection from larger deflection (qR = R – q ; Sr = S – r ; Rs = R – s ) .
- Thus on reaching to the nearest multiple of 30 degree , the electrical axis would be in midway of both positive deflections. And if one deflection is having more net positivity , the axis should be considered to be tilted towards that lead by the range of 100.
Then it becomes easier to graph the mean electrical axis of any particular deflection with reasonable accuracy with an error of approximately 100 (within a few seconds by the process of inspection, but it comes by gradual practice while interpreting the ECGs).
And for this purpose , the hexaxial lead system must be kept always either in mind or on the paper.
- Find the equiphasic lead → The CEA is perpendicular (90°) to this lead.
- The miscellaneous way of calculating QRS axis
- The mean QRS axis points in midway between the axes of two limb leads that show relatively tall R waves of equal amplitude.
- If all the limb leads (except aVR) are showing predominantly positive wave , the axis lies in between +300 to + 600.
In nutshell
The normal frontal QRS axis is at – 300 to +900
The atrial axis P and the T wave axis can also be determined by following the same principle (P axis : 00 to +750). The axis of the T wave should be accessed in relation to that of the QRS complex (the angle between QRS axis and T wave axis , QRS-T angle normally does not exceed 450 – 600 on the frontal plane).
4. Take Home Message
The determination of the electrical axis on 12 lead ECG constitutes a very useful diagnostic pointer while interpreting electrocardiogram. And by its analysis one would also be in a position to interpret the pattern of the different waves with respect to its spatial orientation with reference to the hexaxial lead system. The rule of 90- degree imparts a logical and deductive discipline to delineate ECG axis.
If an exploring electrode is within 90° of the CEA → Positive wave (R wave dominance)
If an electrode is exactly at 90° to the CEA → Equiphasic (R = S) or no deflection
If an electrode is beyond 90° from the CEA → Negative wave (S wave dominance)
CEA = Cardiac Electrical Axis
- The cardiac axis is the sum of all depolarization units of the heart and it is having the maximum flow of current along its axis , having a definite magnitude and direction.
- In any given electromagnetic field the voltage of any waveform depends upon its relative proximity to the electrical axis – the more nearer is the wave to the electrical axis , the more will be its voltage intensity reflected by its amplitude.
- Electrical axis hypothesis is delineated which states that electrical axis is an electrical field vector and the voltage recorded in a particular lead is the result of angulation in between cardiac electrical axis and the lead vector itself. The amount of flow of the current through a particular lead is inversely proportional to the angulation in between cardiac vector and lead vector.
References:
- A brief review : history to understand fundamentals of electrocadiography – MajdAlGhatrif, MD and Joseph Lindsay, MD (J Community Hosp Intern Med Perspect 2012) – https://pubmed.ncbi.nlm.nih.gov/23882360/
- A Concise History of the ECG – https://en.ecgpedia.org/wiki/A_Concise_History_of_the_ECG
- Marriott’s Practical Electrocardiography (South Asian Edition – 12th Edition ) , P 2 – 43
- LeoSchamroth An introduction to Electrocardiography (Eighth adapted edition), P 20 -27
- GOLDBERGER’S CLINICAL ELECTROCARDIOGRAPHY (First South Asia Edition), P 41-49
- ECG Axis Interpretation , Mike Cadogan and Robert Buttner Nov 17, 2024 https://litfl.com/ecg-axis-interpretation/
- What is Cardiac Axis ? March 6 , 2011 https://geekymedics.com/what-is-cardiac-axis/
- The electrical axis of the heart https://ecgwaves.com/electrical-axis-of-the-heart-ecg-physiology-definition/
- ECG Basics Determining Axis , BySteven Lome, MD https://www.healio.com/cardiology/learn-the-heart/ecg-review/ecg-interpretation- tutorial/determining-axis

Discover CME INDIA

- Explore CME INDIA Repository
- Examine CME INDIA Case Study
- Read History Today in Medicine
- Register for Future CMEs