
CME INDIA Presentation by Dr. Akashkumar Singh, MD (Med), MSc (Diabetes), FRCP (Edin), FRCP (Glasgow), FACP, FICP, FRSSDI, Fellow – Diabetes India, FISH, FIACM, FISC, FCCDSI.
From the OPD desk to evidence for the next generation.
Based on a Presentation at CG-RSSDI Annual Conference, Raipur on 1/11/2026.
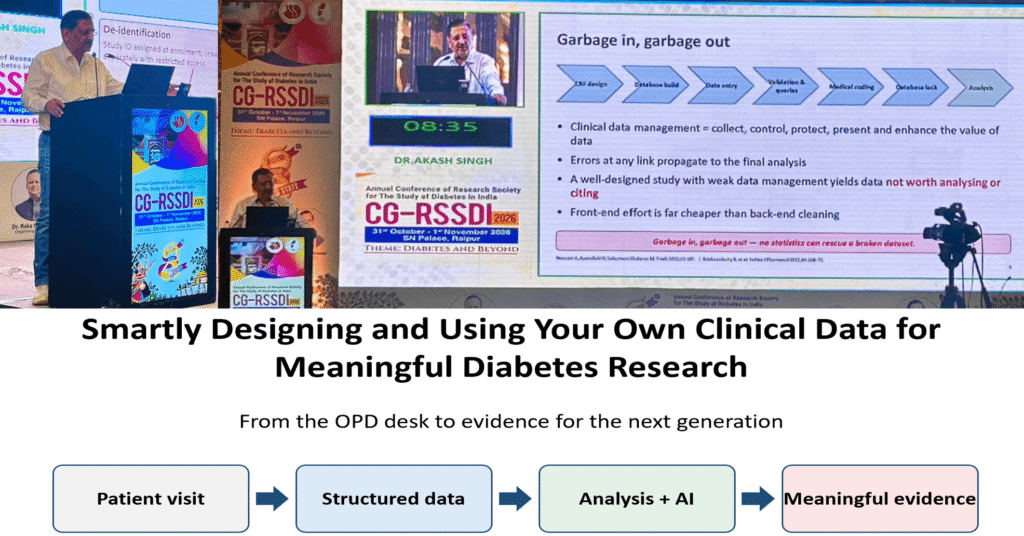
Your clinic is already a cohort — design it like one.
Introduction: every OPD visit generates data
A busy diabetes clinic in India records thousands of HbA1c values, lipid profiles, blood pressure readings and prescriptions every year. Most of this information stays locked in paper files, free-text notes or scattered spreadsheets, and is used once — for the visit at hand — and then forgotten. Unstructured data, however large, cannot answer a research question. The same data, captured in a structured way from day one, becomes a registry, a cohort and a hypothesis-testing engine.3,4
The difference is not the size of the clinic or the budget of the department. It is the difference between passive record-keeping (free text, missing dates, units that vary from doctor to doctor) and a proactive research architecture (coded fields, time-stamped values, validation rules and data that can be reused for years). This article sets out a practical, six-step framework — the Genesis approach — that any practising physician can use to turn routine diabetes care into publishable, practice-changing evidence.
Why Indian clinics must generate Indian data
The ICMR-INDIAB study, which surveyed 113,043 adults across India between 2008 and 2020, estimated the prevalence of diabetes at 11.4% (about 101 million adults) and of prediabetes at 15.3% (about 136 million adults).1 The Asian Indian phenotype differs from that of Europeans: diabetes appears at a younger age, with more abdominal fat and greater insulin resistance at a lower body mass index. The INSPIRED study (n = 19,084) identified two clusters of type 2 diabetes in Indian patients that had not been described in European cohorts.2
This matters for research and for artificial intelligence (AI). Risk scores, treatment algorithms and machine-learning models trained on Western populations may not transfer accurately to our patients. Global algorithms will continue to be applied to local patients; only well-designed local data can close that gap.
What a “Genesis study” means
In the sense used here, a Genesis study is research that begins at the point of data creation rather than at the point of analysis. It has three elements:
- Creation — building a registry from scratch using the clinic’s own electronic medical record (EMR) or patient files.
- Root origin — knowing where each value comes from (which laboratory, which method, which date) and ensuring quality at the point of entry.
- Structured baseline — organising data so that it can answer today’s question and the questions that have not yet been asked.
The central principle is simple: research quality is decided at the moment of data entry, not at the moment of analysis. No statistical technique can repair data that were captured badly at their source.4,6
The reality: how research data are managed today
Nourani and colleagues interviewed 16 diabetes trial researchers from three endocrinology and metabolism institutes.4 They found that data were mostly collected on paper questionnaires, with laboratory reports re-written by hand; that Excel and SPSS were used in place of clinical data-management software; that confidentiality relied on locked cabinets and patient codes rather than technical safeguards; that quality control consisted of manual checks without a formal plan; and that adverse events were described in words rather than coded. Each centre ran its own process, with no common standard. Many Indian clinics will recognise this picture.
Clinical data management has been defined as the process of collecting, controlling, protecting, presenting and enhancing the value of data.5 It is a chain — case report form (CRF) design, database build, data entry, validation and queries, medical coding, database lock and analysis — and an error at any link propagates to the final result. A well-designed study with weak data management yields data that are not worth analysing or citing. Front-end effort is far cheaper than back-end cleaning: garbage in, garbage out.
The Genesis framework: six steps to evidence
The framework below (Figure 1) draws on established data-quality and data-stewardship principles, including the harmonised data-quality framework of Kahn et al. and the FAIR (Findable, Accessible, Interoperable, Reusable) principles.6,7 It is a cycle: the findings of one study generate the next question.
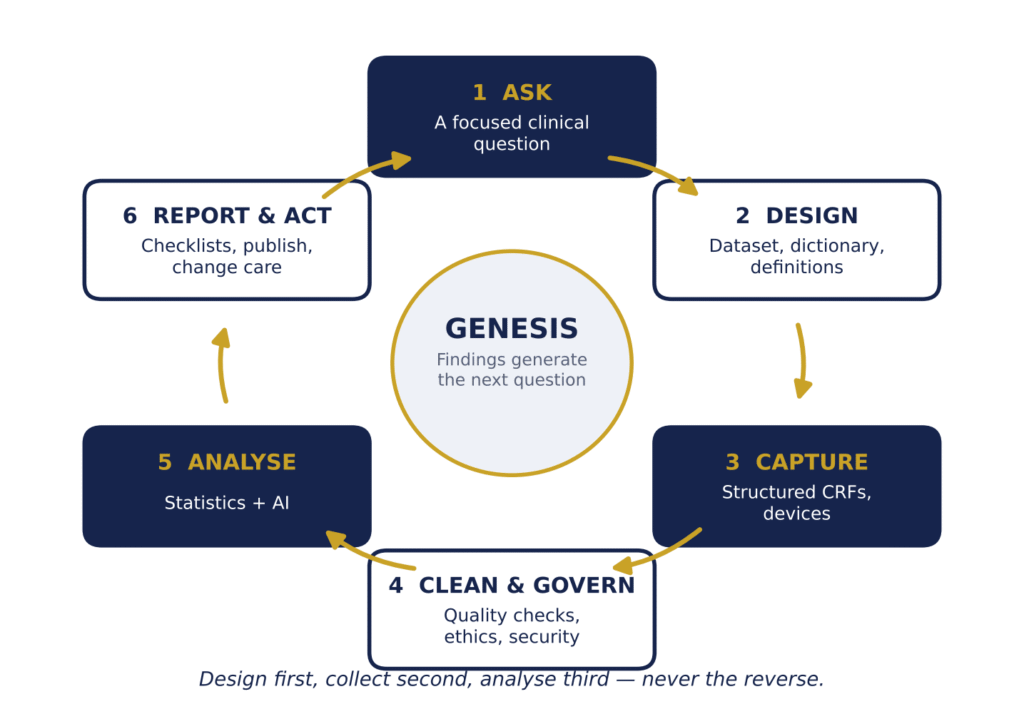
Figure 1. The Genesis framework — six steps from clinical question to practice change. Design first, collect second, analyse third.
Step 1 — Ask: start with a question, not a spreadsheet
A good research question passes the FINER test: it is Feasible (enough patients, follow-up time and data), Interesting (to you, colleagues and journals), Novel (it confirms, refutes or extends evidence), Ethical (approvable by the ethics committee) and Relevant (the answer could change practice).8 The question is then framed in PICO format. For example: in adults with type 2 diabetes attending my clinic with eGFR ≥30 mL/min/1.73 m² (P), does starting an SGLT2 inhibitor (I), compared with starting a DPP-4 inhibitor (C), slow the eGFR decline over two years (O)? This question immediately tells you what you must collect: drug start dates, serial creatinine, baseline urine albumin–creatinine ratio (UACR) and concomitant medications. A clear question decides the variables; a spreadsheet without a question collects everything except what you need.
Step 2 — Design: match the question to the study design
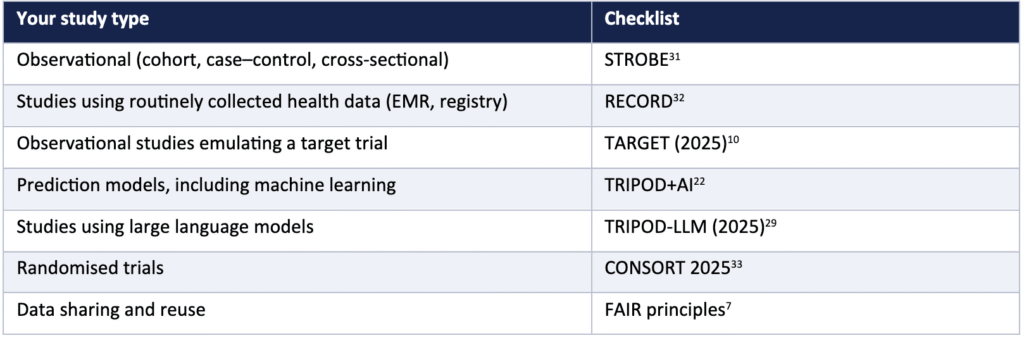
Different questions need different designs (Table 1). Observational clinic data show association; causal claims require design, not just data. Target-trial emulation — specifying the randomised trial you would have liked to run and then emulating it with observational data — is a powerful way to study comparative effectiveness from routine records.9 The new TARGET guideline (2025) now sets out how such studies should be reported.10
Table 1. Matching the research question to the study design
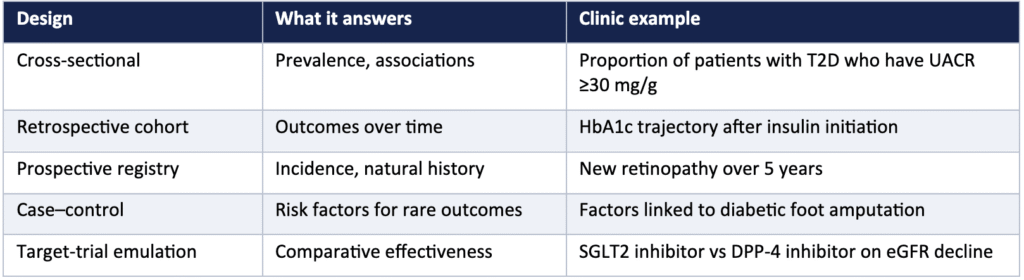
Adapted from Hernán & Robins9 and Sherman et al.3
Minimum dataset, data dictionary and standard definitions
Resist the temptation to collect everything. In a survey of 60 diabetes trial researchers, Nourani et al. used a ≥60% agreement rule to identify an essential minimum dataset.11 Start with a lean core and add fields only when a question needs them — every extra field costs time and adds missing data. The core domains for a diabetes clinic are: demographics and chronology (age at diagnosis, duration, sex, residence, family history); metabolic measures (serial HbA1c, fasting and post-prandial glucose, lipids, BMI, waist, blood pressure); therapy (drug class, dose, start and stop dates, adherence); complications (UACR, eGFR, retinopathy grade, monofilament or VPT, ankle–brachial index, coronary disease); and digital data (CGM metrics, glucometer logs, steps, weight). Above all, time-stamp every value — dates turn records into cohorts.
Before the first patient is entered, write a data dictionary (Table 2). Every variable needs a name, a definition, a unit, an allowed range and a type. The test is simple: if two doctors can record it differently, it is not yet defined.
Table 2. Example data dictionary entries
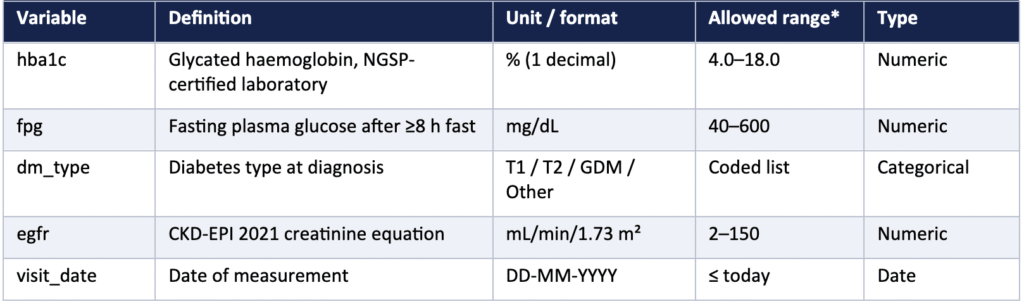
*Illustrative limits — set and document locally. Based on Kahn et al.,6 FAIR principles7 and KDIGO 2024.13
Use standard definitions so that your data can be compared with — and published alongside — others. The American Diabetes Association Standards of Care 2026 retain the diagnostic thresholds of HbA1c ≥6.5%, fasting plasma glucose ≥126 mg/dL, 2-hour plasma glucose ≥200 mg/dL on a 75-g OGTT, or random plasma glucose ≥200 mg/dL with classic symptoms; prediabetes is HbA1c 5.7–6.4%, FPG 100–125 mg/dL or 2-h glucose 140–199 mg/dL. In the absence of symptoms, the diagnosis should be confirmed by repeat testing.12 Chronic kidney disease follows KDIGO 2024: eGFR <60 mL/min/1.73 m² and/or UACR ≥30 mg/g persisting for more than three months.13
Step 3 — Capture: from free text to structured CRFs
Consider a typical note: “Sugar high, on metformin, feet OK, eyes to be checked.” It is useful for the next visit but useless for research. The same encounter in a structured CRF reads: FPG 182 mg/dL; metformin 1000 mg twice daily; monofilament 10/10 sites; fundus examination not done. Good CRFs use drop-downs and coded lists instead of typing, fix units in the form rather than letting users type them, keep one variable per field, make core fields mandatory and are built separately for each visit type.4,11 Write notes for patients, capture data for research — a well-designed CRF can do both.
Quality should be built in at the point of entry through logic rules (if diabetes type is GDM, disease duration cannot exceed nine months) and range rules (an HbA1c outside 4.0–18.0% is blocked with a message). An error prevented at entry never needs cleaning.
Continuous glucose monitoring (CGM) has given us a standardised research variable that is comparable across clinics (Figure 2). The international consensus targets for most adults are time in range (70–180 mg/dL) >70%, time below 70 mg/dL <4%, time below 54 mg/dL <1%, time above 180 mg/dL <25% and time above 250 mg/dL <5%, with a coefficient of variation ≤36%; at least 14 days of data with ≥70% sensor wear are needed.14 Store metrics per reporting period, with the device and dates recorded.
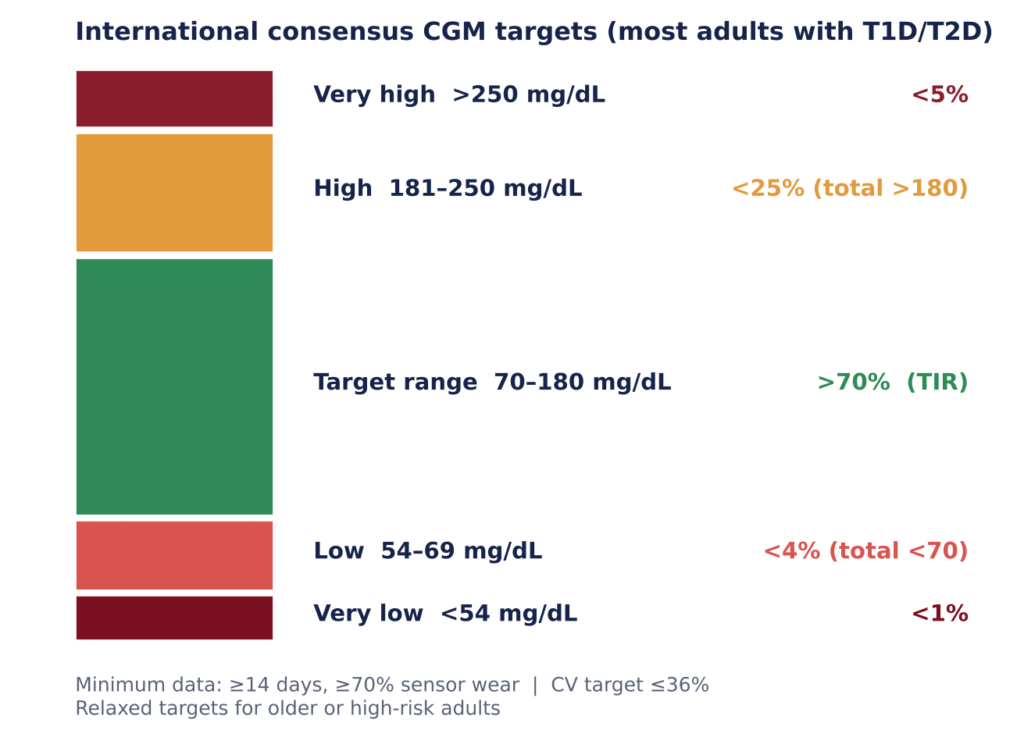
Figure 2. CGM time-in-ranges as research variables (Battelino et al., 2019).14 Targets are relaxed for older or high-risk adults.
Choose the right tool: Excel is not a database
Spreadsheets are convenient but unsafe for research. Validation is limited and easily bypassed, there is no audit trail and no role-based access. REDCap (Research Electronic Data Capture), developed at Vanderbilt University, provides field validation, a full audit trail, user roles, automated export to SPSS, R, SAS and Stata, and multi-centre web entry — and is available without licence fees to non-profit institutions that join the consortium (Table 3).15,16
Table 3. Excel versus REDCap versus a dedicated clinical data-management system (CDMS)
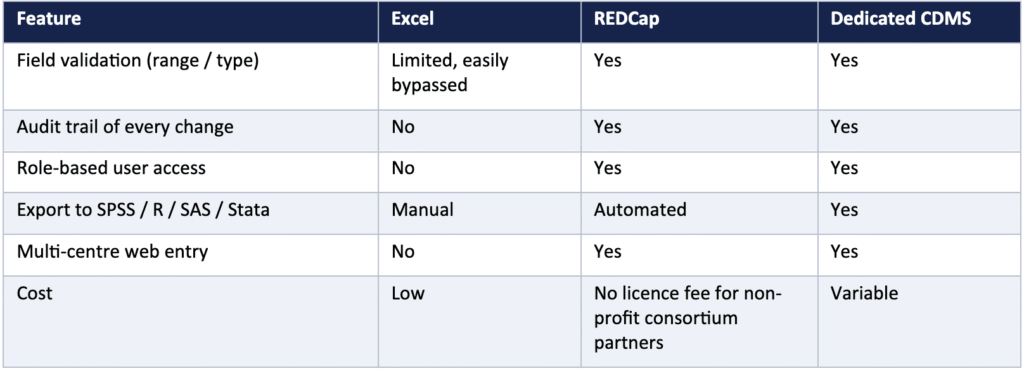
Sources: Harris et al. 2009 and 2019;15,16 Nourani et al.11
Think in trajectories, not snapshots
A single HbA1c is a value; ten HbA1c values are a story. In Figure 3, patient B appears controlled at six months, while the full trajectory reveals steady deterioration. To make trajectories analysable, fix visit windows (for example, every three months), use the same laboratory method over time, and date every result and every event.3
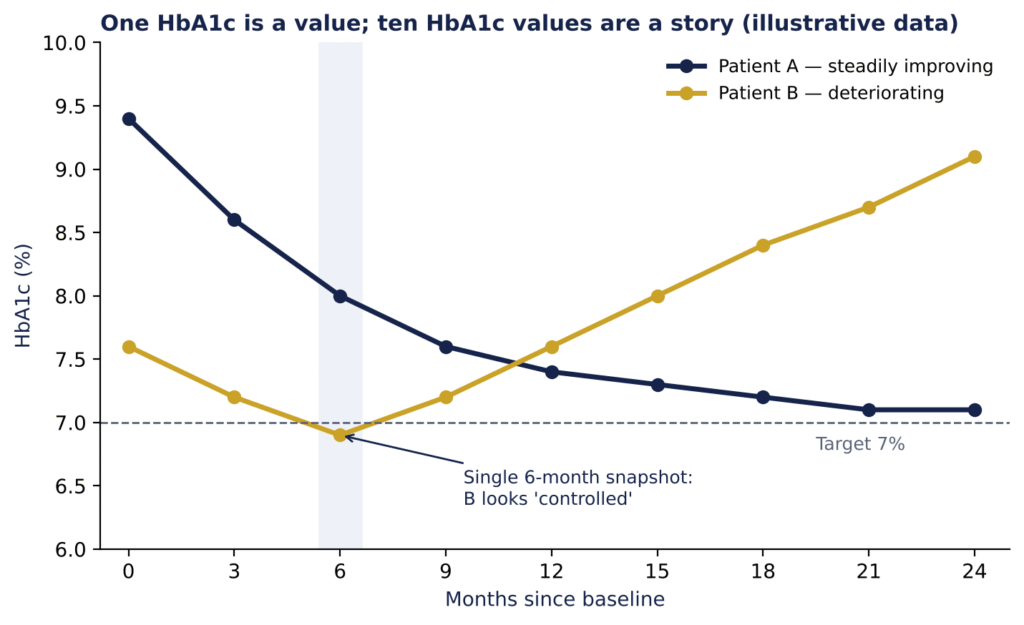
Figure 3. Trajectories versus snapshots (illustrative data). A cross-sectional look at six months misclassifies patient B.
Digital devices add richness but also missingness. In a six-month study of 60 adults with type 2 diabetes using a wireless glucometer, wrist activity tracker, cellular body scale and SMS adherence surveys feeding into a secure research platform, the primary outcome was simply the proportion of 180 days on which data were transmitted — and missingness was compared by age, HbA1c and race.17 The lesson is that missing data is a design problem: plan reminders, technical support and follow-up calls from the outset. Devices generate data; only design generates usable data.
Step 4 — Clean and govern
Data quality has five practical dimensions: accuracy (the value matches the source), precision (the right detail and unit), timeliness (entered close to the visit), completeness (core fields are not missing) and consistency (the value agrees with other fields).4 For EHR-derived data, Kahn’s framework of conformance, completeness and plausibility is a useful checklist.6 Run quality reports monthly, not only at the end, and log every correction in an audit trail. Clean as you go — not at the end of five years.
Governance is non-negotiable. Obtain Institutional Ethics Committee approval and informed consent — or a justified waiver for minimal-risk record-based research — as set out in the ICMR National Ethical Guidelines.18 The Digital Personal Data Protection (DPDP) Act, 2023 requires a lawful purpose, notice and consent, and reasonable security safeguards for digital personal data.19 The DPDP Rules, 2025, notified on 13 November 2025, are being implemented in phases, with most obligations on data fiduciaries taking effect by May 2027; clinics building research databases now should design for compliance from the start.20 Assign a study ID at enrolment, keep the linkage key separately with restricted access, and use role-based access, strong passwords, encryption, regular backups and audit logs. Ethics approval comes before analysis — not after the results look interesting.
Step 5 — Analyse: from description to prediction, with AI
Analysis moves up a ladder: descriptive (what is happening — prevalence, means, control rates), analytical (what is associated — regression, survival analysis, adjusted hazard ratios), predictive (who is at risk — risk scores and machine-learning models) and prescriptive (what should we do — drug-choice and insulin-dosing tools).21,22 Whatever the level, write the statistical analysis plan before you look at the outcome.
The AI toolbox for clinic data includes unsupervised clustering (k-means, hierarchical) for phenotype discovery, supervised learning (logistic regression, random forest, support vector machines) for risk prediction, convolutional neural networks for images such as fundus photographs,23 rule-based or fuzzy expert systems, and large language models (LLMs) for summarisation, education and code drafting. Pick the tool for the question — not the question for the tool.
Routine clinic variables, carefully collected, have already reshaped how we classify diabetes. Ahlqvist et al. clustered 8,980 Swedish patients using six variables (GAD antibodies, age at diagnosis, BMI, HbA1c, HOMA2-B and HOMA2-IR) into five subgroups, with severe insulin-deficient diabetes (SIDD) carrying the highest retinopathy risk and severe insulin-resistant diabetes (SIRD) the highest kidney risk.24 The Indian INSPIRED study used eight routine variables, including fasting and stimulated C-peptide, and identified four clusters, of which two — insulin-resistant obese diabetes (IROD) and combined insulin-resistant and deficient diabetes (CIRDD) — were novel; CIRDD carried the highest kidney-disease hazard.2
Routine variables can also personalise therapy. Dennis et al. used just nine routinely available features (age, duration, sex, HbA1c, BMI, eGFR, HDL-cholesterol, total cholesterol and ALT) across 100,107 drug initiations to build a model that predicts which of five drug classes — DPP-4 inhibitors, GLP-1 receptor agonists, SGLT2 inhibitors, sulfonylureas or thiazolidinediones — is likely to give the greatest glycaemic benefit for an individual.25 Zeevi et al. predicted individual post-meal glucose responses in an 800-person cohort and validated the model in 100 independent participants,26 and automated insulin-dosing guidance lowered HbA1c by about 1.0% at six months in a randomised trial.27
Using AI safely to test hypotheses
Generative AI can accelerate analysis, but it must sit inside a safe workflow (Figure 4). De-identify and freeze the dataset; state the hypothesis and analysis plan; let AI draft code or explore; run the code locally in R, Python or SPSS; have a clinician and a statistician verify the output; and validate the finding in new data. Never upload identifiable patient data to public AI tools. LLMs can hallucinate facts and produce plausible but wrong code, and the ICMR guidelines on AI in biomedical research are clear that the investigator remains accountable.28 Studies that use LLMs should now be reported according to TRIPOD-LLM.29
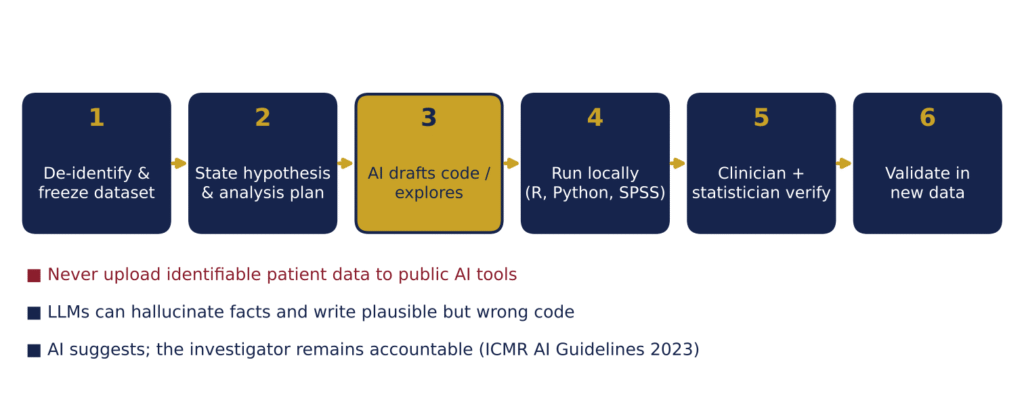
Figure 4. A safe six-step workflow for AI-assisted hypothesis testing on clinic data.
Beware the “perfect” model. Published diabetes classifiers built on a few hundred records sometimes report accuracies of 100% after internal cross-validation alone. Red flags include accuracy of 100% on clinical data, reported error and accuracy that do not add up, no external validation cohort, no calibration, and unsupervised clusters relabelled as diagnoses. TRIPOD+AI requires discrimination, calibration and validation to be reported transparently.22 If accuracy is 100%, check your data before you celebrate.
Equity deserves explicit attention. Models built on Western data may underperform in Indian patients; smartphone and wearable data under-represent poorer and older patients; and generative AI raises new safety concerns.30 The remedies are representative datasets, subgroup testing, regular audits and, where data cannot leave an institution, federated learning. Indian clinics generating Indian data is itself an act of equity.
Step 6 — Report it right and act
Good data deserve good reporting, and the checklist is a peer reviewer’s first question (Table 4). Two important updates appeared in 2025: CONSORT 2025 for randomised trials33 and TARGET for observational studies that emulate a target trial.10
Table 4. Reporting guidelines by study type (updated 2025)
Take-home messages
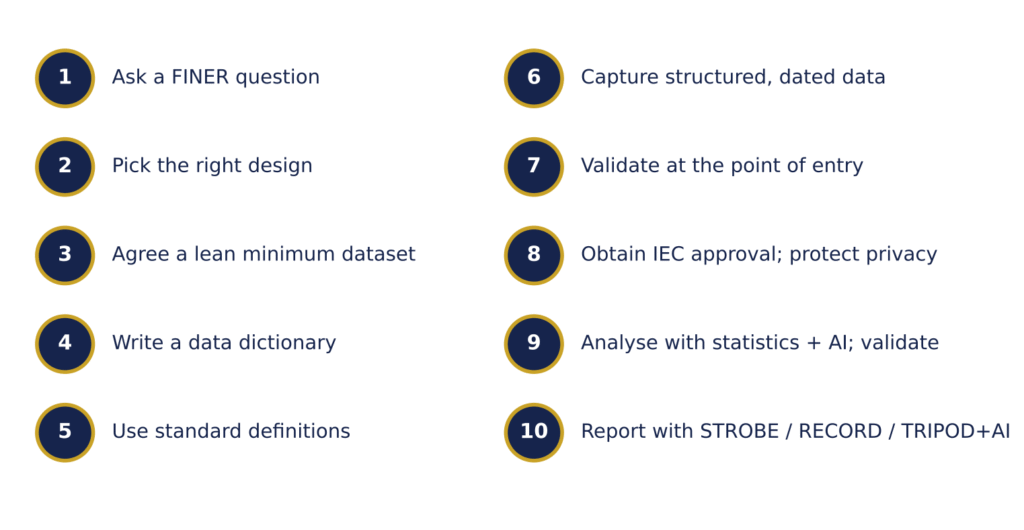
Figure 5. Ten steps to turn a diabetes clinic into a research engine.
Research in diabetes does not begin in a laboratory or a funding agency; it begins at the OPD desk, with a question, a data dictionary and the discipline to record every value in a structured, dated and validated way. Indian clinicians see more people with diabetes than almost anyone in the world. If we design today’s data well, our own patients — and the next generation of physicians — will inherit evidence that truly fits them.
Design today’s data for tomorrow’s patients — your clinic is where diabetes research begins.
References:
1. Anjana RM, Unnikrishnan R, Deepa M, et al. Metabolic non-communicable disease health report of India: the ICMR-INDIAB national cross-sectional study (ICMR-INDIAB-17). Lancet Diabetes Endocrinol. 2023;11(7):474–89. doi: 10.1016/S2213-8587(23)00119-5
2. Anjana RM, Baskar V, Nair ATN, et al. Novel subgroups of type 2 diabetes and their association with microvascular outcomes in an Asian Indian population: a data-driven cluster analysis: the INSPIRED study. BMJ Open Diabetes Res Care. 2020;8(1):e001506. doi: 10.1136/bmjdrc-2020-001506
3. Sherman RE, Anderson SA, Dal Pan GJ, et al. Real-world evidence — what is it and what can it tell us? N Engl J Med. 2016;375(23):2293–7. doi: 10.1056/NEJMsb1609216
4. Nourani A, Ayatollahi H, Solaymani Dodaran M. Data management in diabetes clinical trials: a qualitative study. Trials. 2022;23(1):187. doi: 10.1186/s13063-022-06110-6
5. Krishnankutty B, Bellary S, Kumar NB, Moodahadu LS. Data management in clinical research: an overview. Indian J Pharmacol. 2012;44(2):168–72. doi: 10.4103/0253-7613.93842
6. Kahn MG, Callahan TJ, Barnard J, et al. A harmonized data quality assessment terminology and framework for the secondary use of electronic health record data. EGEMS (Wash DC). 2016;4(1):1244. doi: 10.13063/2327-9214.1244
7. Wilkinson MD, Dumontier M, Aalbersberg IJ, et al. The FAIR Guiding Principles for scientific data management and stewardship. Sci Data. 2016;3:160018. doi: 10.1038/sdata.2016.18
8. Hulley SB, Cummings SR, Browner WS, Grady DG, Newman TB. Designing Clinical Research. 4th ed. Philadelphia: Lippincott Williams & Wilkins; 2013.
9. Hernán MA, Robins JM. Using big data to emulate a target trial when a randomized trial is not available. Am J Epidemiol. 2016;183(8):758–64. doi: 10.1093/aje/kwv254
10. Cashin AG, Hansford HJ, Hernán MA, et al. Transparent reporting of observational studies emulating a target trial: the TARGET statement. BMJ. 2025;390:e087179.
11. Nourani A, Ayatollahi H, Solaymani-Dodaran M. J Healthc Eng. 2022;2022:8421529. doi: 10.1155/2022/8421529
12. American Diabetes Association Professional Practice Committee. 2. Diagnosis and classification of diabetes: Standards of Care in Diabetes—2026. Diabetes Care. 2026;49(Suppl 1). doi: 10.2337/dc26-S002
13. Kidney Disease: Improving Global Outcomes (KDIGO) CKD Work Group. KDIGO 2024 clinical practice guideline for the evaluation and management of chronic kidney disease. Kidney Int. 2024;105(4S):S117–S314. doi: 10.1016/j.kint.2023.10.018
14. Battelino T, Danne T, Bergenstal RM, et al. Clinical targets for continuous glucose monitoring data interpretation: recommendations from the International Consensus on Time in Range. Diabetes Care. 2019;42(8):1593–603. doi: 10.2337/dci19-0028
15. Harris PA, Taylor R, Thielke R, et al. Research electronic data capture (REDCap) — a metadata-driven methodology and workflow process for providing translational research informatics support. J Biomed Inform. 2009;42(2):377–81. doi: 10.1016/j.jbi.2008.08.010
16. Harris PA, Taylor R, Minor BL, et al. The REDCap consortium: building an international community of software platform partners. J Biomed Inform. 2019;95:103208. doi: 10.1016/j.jbi.2019.103208
17. Shaw RJ, et al. JMIR Res Protoc. 2019;8(5):e13517. doi: 10.2196/13517
18. Indian Council of Medical Research. National Ethical Guidelines for Biomedical and Health Research Involving Human Participants. New Delhi: ICMR; 2017.
19. Government of India. The Digital Personal Data Protection Act, 2023 (No. 22 of 2023). New Delhi: Ministry of Law and Justice; 2023.
20. Ministry of Electronics and Information Technology. Digital Personal Data Protection Rules, 2025. Notified 13 November 2025. New Delhi: Government of India; 2025.
21. Rajkomar A, Dean J, Kohane I. Machine learning in medicine. N Engl J Med. 2019;380(14):1347–58. doi: 10.1056/NEJMra1814259
22. Collins GS, Moons KGM, Dhiman P, et al. TRIPOD+AI statement: updated guidance for reporting clinical prediction models that use regression or machine learning methods. BMJ. 2024;385:e078378. doi: 10.1136/bmj-2023-078378
23. Gulshan V, Peng L, Coram M, et al. Development and validation of a deep learning algorithm for detection of diabetic retinopathy in retinal fundus photographs. JAMA. 2016;316(22):2402–10. doi: 10.1001/jama.2016.17216
24. Ahlqvist E, Storm P, Käräjämäki A, et al. Novel subgroups of adult-onset diabetes and their association with outcomes: a data-driven cluster analysis of six variables. Lancet Diabetes Endocrinol. 2018;6(5):361–9. doi: 10.1016/S2213-8587(18)30051-2
25. Dennis JM, Young KG, Cardoso P, et al. A five-drug class model using routinely available clinical features to optimise prescribing in type 2 diabetes: a prediction model development and validation study. Lancet. 2025;405(10480):701–14. doi: 10.1016/S0140-6736(24)02617-5
26. Zeevi D, Korem T, Zmora N, et al. Personalized nutrition by prediction of glycemic responses. Cell. 2015;163(5):1079–94. doi: 10.1016/j.cell.2015.11.001
27. Bergenstal RM, Johnson M, Passi R, et al. Automated insulin dosing guidance to optimise insulin management in patients with type 2 diabetes: a multicentre, randomised controlled trial. Lancet. 2019;393(10176):1138–48. doi: 10.1016/S0140-6736(19)30368-X
28. Indian Council of Medical Research. Ethical Guidelines for Application of Artificial Intelligence in Biomedical Research and Healthcare. New Delhi: ICMR; 2023.
29. Gallifant J, Afshar M, Ameen S, et al. The TRIPOD-LLM reporting guideline for studies using large language models. Nat Med. 2025;31(1):60–9. doi: 10.1038/s41591-024-03425-5
30. Deng M, Yang R, Zheng X, et al. Artificial intelligence in diabetes care: from predictive analytics to generative AI and implementation challenges. Front Endocrinol (Lausanne). 2025;16:1620132. doi: 10.3389/fendo.2025.1620132
31. von Elm E, Altman DG, Egger M, et al. The Strengthening the Reporting of Observational Studies in Epidemiology (STROBE) statement: guidelines for reporting observational studies. Lancet. 2007;370(9596):1453–7. doi: 10.1016/S0140-6736(07)61602-X
32. Benchimol EI, Smeeth L, Guttmann A, et al. The REporting of studies Conducted using Observational Routinely-collected health Data (RECORD) statement. PLoS Med. 2015;12(10):e1001885. doi: 10.1371/journal.pmed.1001885
33. Hopewell S, Chan AW, Collins GS, et al. CONSORT 2025 statement: updated guideline for reporting randomised trials. BMJ. 2025;389:e081123. doi: 10.1136/bmj-2024-081123
Published for educational purposes; not a substitute for individual clinical judgement.
Discover CME INDIA

- Explore CME INDIA Repository
- Examine CME INDIA Case Study
- Read History Today in Medicine
- Register for Future CMEs